Dashboard
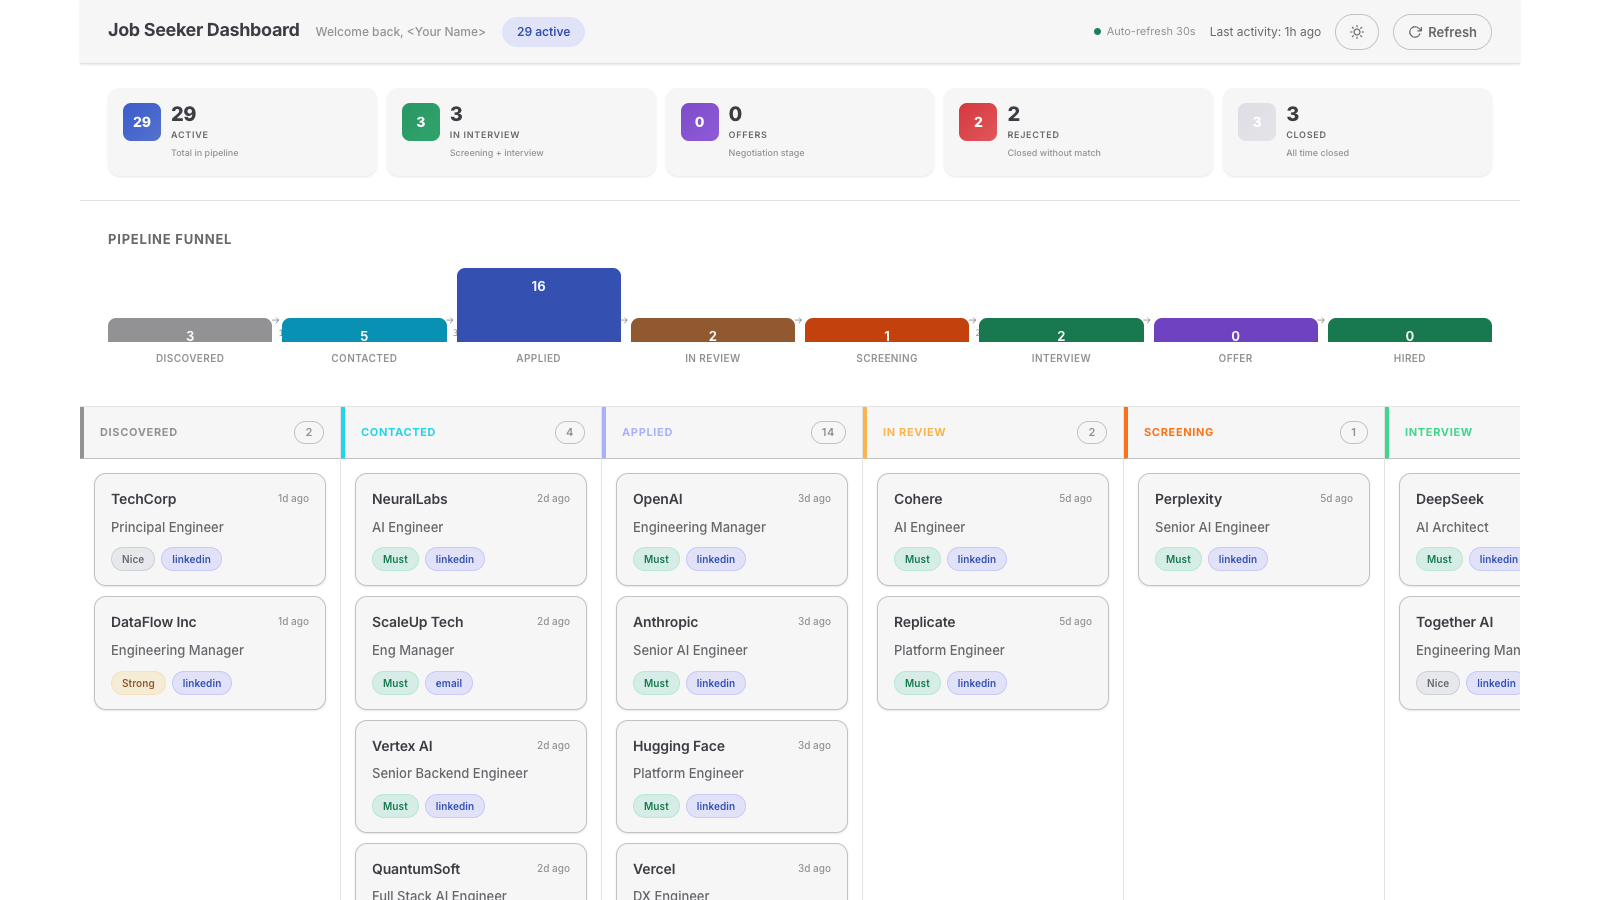
A local web dashboard that visualizes your job application pipeline in real time. The agent opens it at the end of each round so you can review the results visually.
Launch
node scripts/dashboard.js --openThis starts a local server at http://localhost:7531 and opens it in your default browser.
Options
| Flag | Description | Default |
|---|---|---|
--port <n> | Port number | 7531 |
--open | Open in default browser automatically | false |
-h, --help | Show help |
When the agent opens it
The dashboard skill triggers at the end of any round that changes the pipeline:
- After
applyfinishes applying to jobs - After
newsfinishes processing updates - After
dailycompletes its routine - After
targetsfinishes registering or applying - When you say
dashboard, "show me the pipeline", or "show dashboard"
What it shows
KPI stats
Five professional cards at the top, each with a gradient icon container, a large metric, a label, and a small sub-label for context:
| Stat | What it counts | Sublabel |
|---|---|---|
| Active | Applications in any active stage (discovered through hired) | Total in pipeline |
| In Interview | Applications in screening or interview stages | Screening + interview |
| Offers | Applications with an offer | Negotiation stage |
| Rejected | Applications rejected | Closed without match |
| Closed | Total closed (rejected + withdrawn + skipped) | All time closed |
Pipeline funnel
A bar chart with gradient bars showing the count at each stage, plus arrows and stage-to-stage conversion rates. The funnel flows left to right: discovered -> contacted -> applied -> in_review -> screening -> interview -> offer -> hired.
Kanban board
Eight columns, one per active stage. Each column has a colored left accent on its header. Each card shows:
- Company name
- Role title
- Match level (Must, Strong, or Nice)
- Platform (linkedin, email, etc.)
- Relative date (just now, 5m ago, 3d ago)
Cards have hover elevation, focus states, and a subtle shadow. The board scrolls horizontally if columns don't fit.
Target companies
A grid of cards showing each registration status with its count and a progress bar representing the share of all targets.
Recent messages
A grid of message cards with:
- An avatar showing the sender's initials
- Channel label (Gmail, LinkedIn, platform)
- Sender and subject
- Status pill (pending, draft, sent, ignored)
- Relative date
Theme
The dashboard supports dark and light themes. Click the sun/moon icon in the header to switch. Your preference is saved in localStorage and restored on reload.
Auto-refresh
The dashboard fetches fresh data from the database every 30 seconds. You can keep it open during a session and watch the pipeline update in real time as the agent applies to jobs or processes messages.
Data source
All data comes from the applications, messages, and company_registrations tables in your Postgres database. The dashboard is read-only. To move cards between stages, use the CLI:
node scripts/pipeline.js --move <id> <stage>Stopping the server
Press Ctrl+C in the terminal where the dashboard is running.